This Chart Indicates Bitcoin May Be Headed for Record Highs Above $73K
Bitcoin Could Be Headed for Record Highs: The Power of the Three-Line Break Chart
Bitcoin traders focusing only on daily candlestick patterns might be missing out on a significant development. The lesser-known three-line break chart is signaling a bullish outlook, hinting that Bitcoin (BTC) may be ready to break out of its months-long correction and push toward record highs above $73,000.
Understanding the Three-Line Break Chart
The three-line break chart is a valuable tool that filters out short-term noise and erratic price movements, allowing traders to focus on larger trend shifts. Unlike candlestick charts, which account for both price and time, the three-line break chart only focuses on price movements. This makes it especially useful for identifying significant trend reversals and confirming the strength of existing trends.
In essence, the chart tracks vertical bars or lines, where:
- A new green bar (bullish reversal) appears when the price exceeds the highest point of the previous three red lines.
- A new red bar (bearish reversal) appears when the price drops below the lowest point of the previous three green lines.
This method helps traders better gauge when trends are truly shifting, providing a clearer view of the broader market momentum.
A Bullish Breakout: What’s Happening Now?
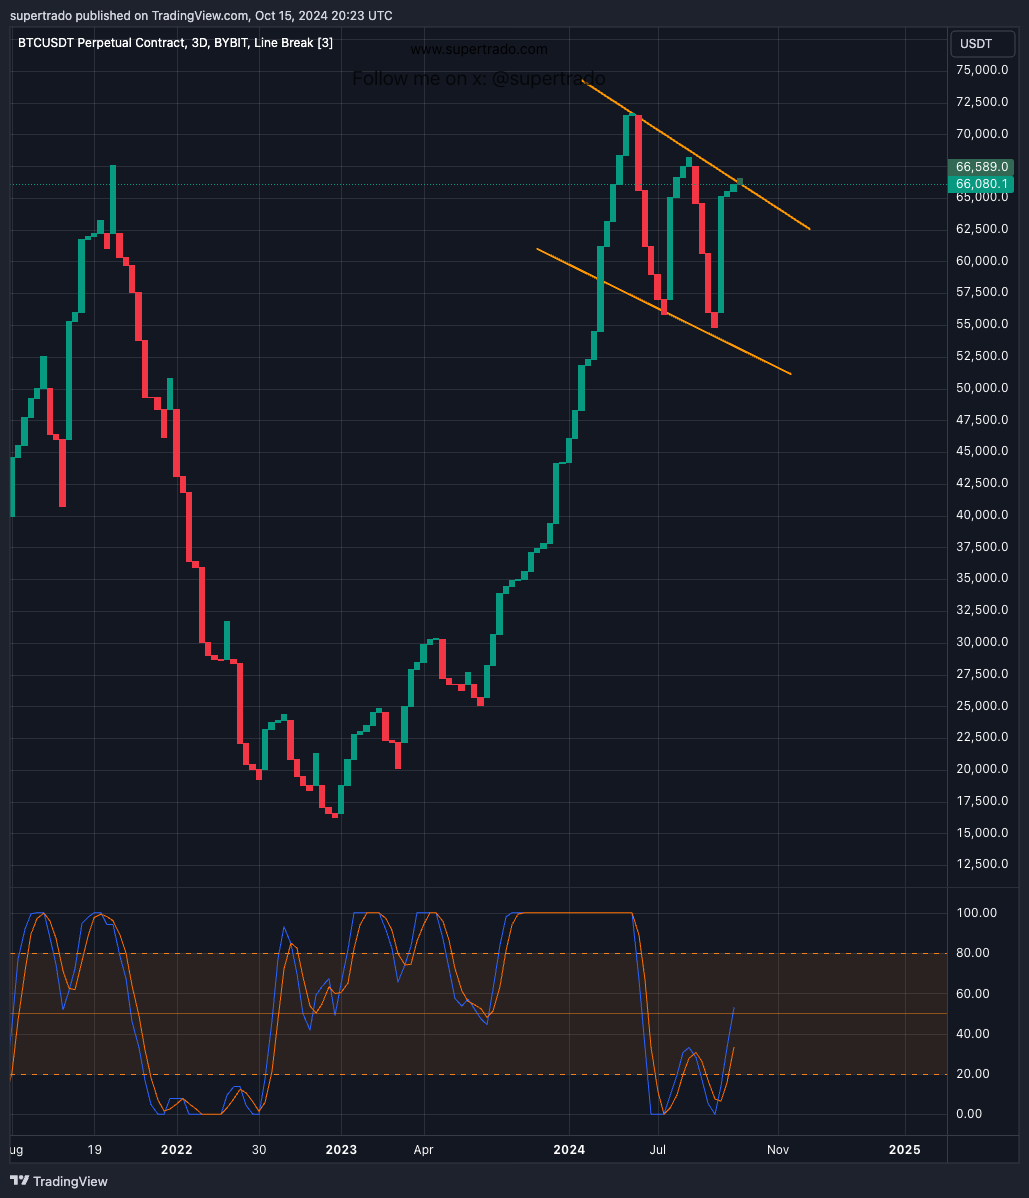
According to this chart, Bitcoin has just broken out of a seven-month-long corrective descending channel. The breakout occurred on Monday, confirming the resumption of the broader uptrend that started from October 2023’s lows near $30,000. With BTC now trading above $66,000 after its biggest single-day gain since August, the three-line break chart suggests there is potential for a rally toward all-time highs above $73,000.
This breakout follows a long period of choppy, directionless price action on the daily candlestick chart. Despite the recent gains, candlesticks still indicate a neutral outlook, as BTC continues to face resistance around the $70,000 mark.
What to Watch Out For: Resistance and Potential Reversals
While the three-line break chart offers a bullish signal, traders should keep an eye on two key elements:
Resistance Around $70,000: Despite the bullish breakout, Bitcoin has repeatedly failed to hold above $70,000 since March. This level has acted as a significant barrier for BTC, and traders should be cautious of this potential resistance point.
Bullish Invalidation: Although the three-line break chart signals a potential move higher, a bearish reversal could occur if a new red bar forms, which would signal a return below the trendline and possibly result in deeper price declines. This is something traders should be wary of, especially after the failed breakouts witnessed in September.
Why the Three-Line Break Chart Matters
For those unfamiliar with this tool, the three-line break chart offers a clearer look at price action by ignoring arbitrary rules and focusing solely on market-driven trends. In his book “Beyond Candlesticks,” Steve Nison highlighted that this chart allows traders to adapt to the strength and dynamism of the market, providing a more nuanced view than traditional candlestick charts.
Right now, this chart indicates that Bitcoin could be setting up for a significant push higher, but traders should remain cautious until BTC clears the $70,000 resistance level.
With the breakout in progress, all eyes will be on Bitcoin to see if it can break free of its recent channel and push toward new all-time highs. Keep a close watch on the charts, and stay tuned for more updates as we continue to track this unfolding story in the crypto market.